Maybe I’m old-fashioned, but I rarely use a debugger when programming. Usually, chucking in some print statements to test my assumptions does the job.
I’ve recently found a surprising use for this dev tool; debugging other people’s code. In particular, 2 checkboxes are usually enough to find exactly what I’m looking for, even in megabytes of minified, proprietary code. This technique is simpler than I thought, so I’ll share it below:
Setting the scene
I first used this while building Webflow integrations at Relume. Our Webflow features mostly worked via the clipboard; we’d write the data in Webflow’s internal, undocumented format, and then the user would paste it into the Webflow app. Sometimes, our data would crash Webflow’s frontend, but it wasn’t clear why.
That scenario felt specific to Relume, so I was reluctant to share it. However, recently I ended up using the same technique in a wildly different situation.
For XINTRA Labs, I was building a Microsoft Entra ID SAML Federation Provider, whatever that means. As part of that, I needed to upload an SAML-formatted XML file to the Entra dashboard. But when I uploaded the file, all I got was a generic error message:

Initially, I opened the browser dev tools and resubmitted the file. I thought the parsing would be done by the backend, but saw no network request made. That left only 1 option; the Entra ID frontend parsed the file. A frontend error calls for the JS debugger:
Finding a bug in somebody else’s frontend
So I was in this situation:
- I could reproduce a bug reliably (uploading a file)
- But I didn’t get a helpful error
To reveal the secrets, I opened my browser’s Debugger (caused the “Sources” tab in Chrome) and checked 2 options: Pause on Uncaught Exceptions and Pause on Caught Exceptions.
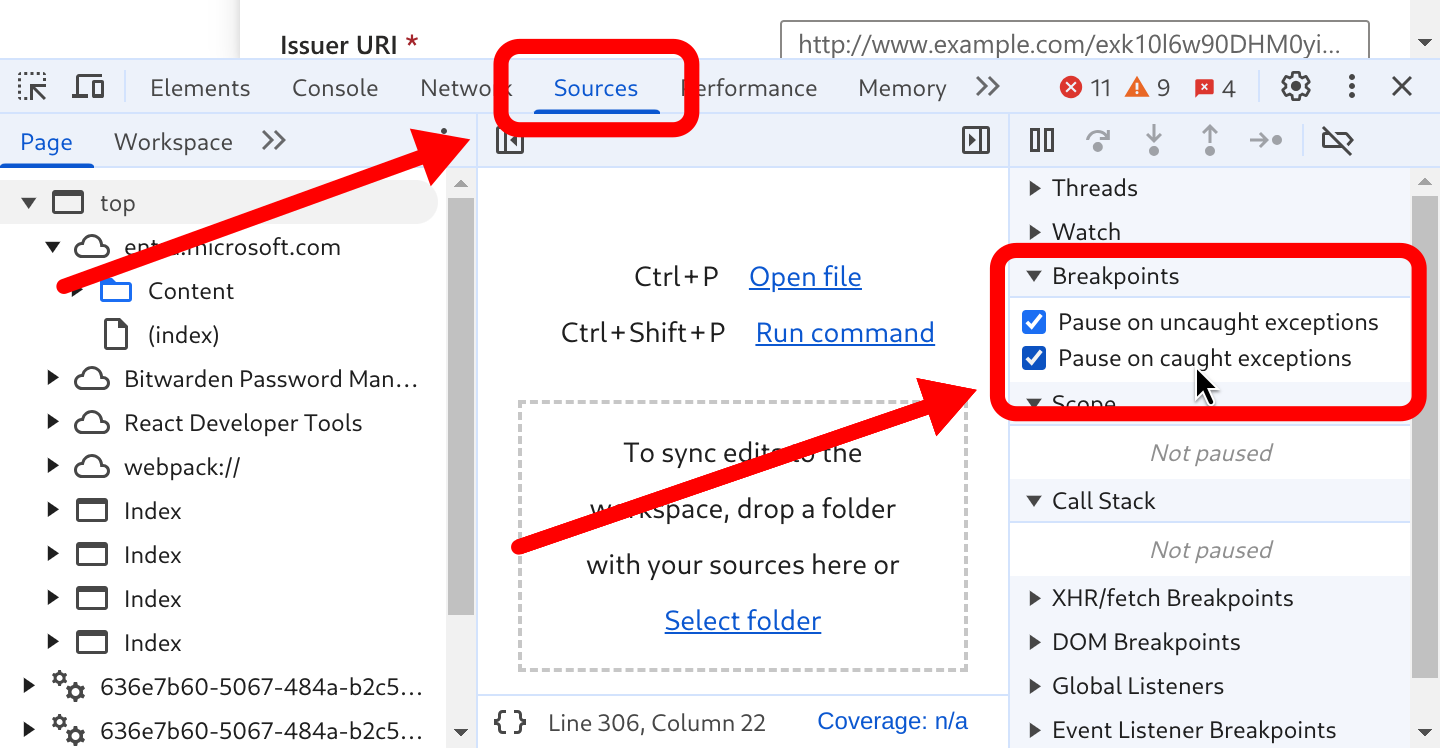
After reproducing the bug, the debugger paused at exactly the code that was causing the error:
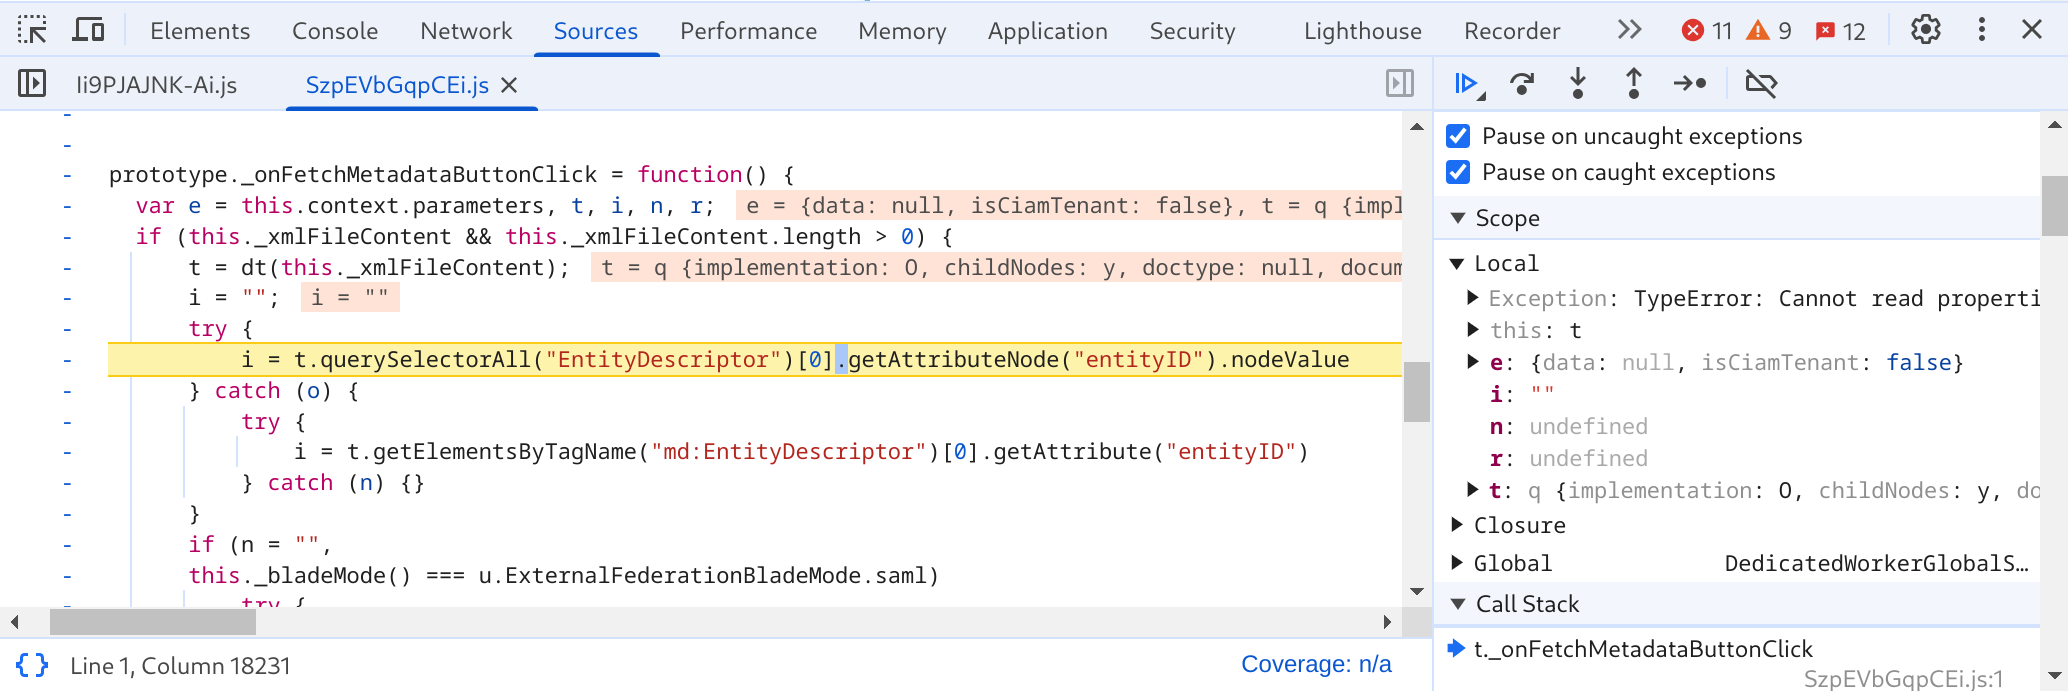
Here, I can see 3 critical things:
- The step where the error originates (finding
EntityDescriptorXML element) - The variables of interest (
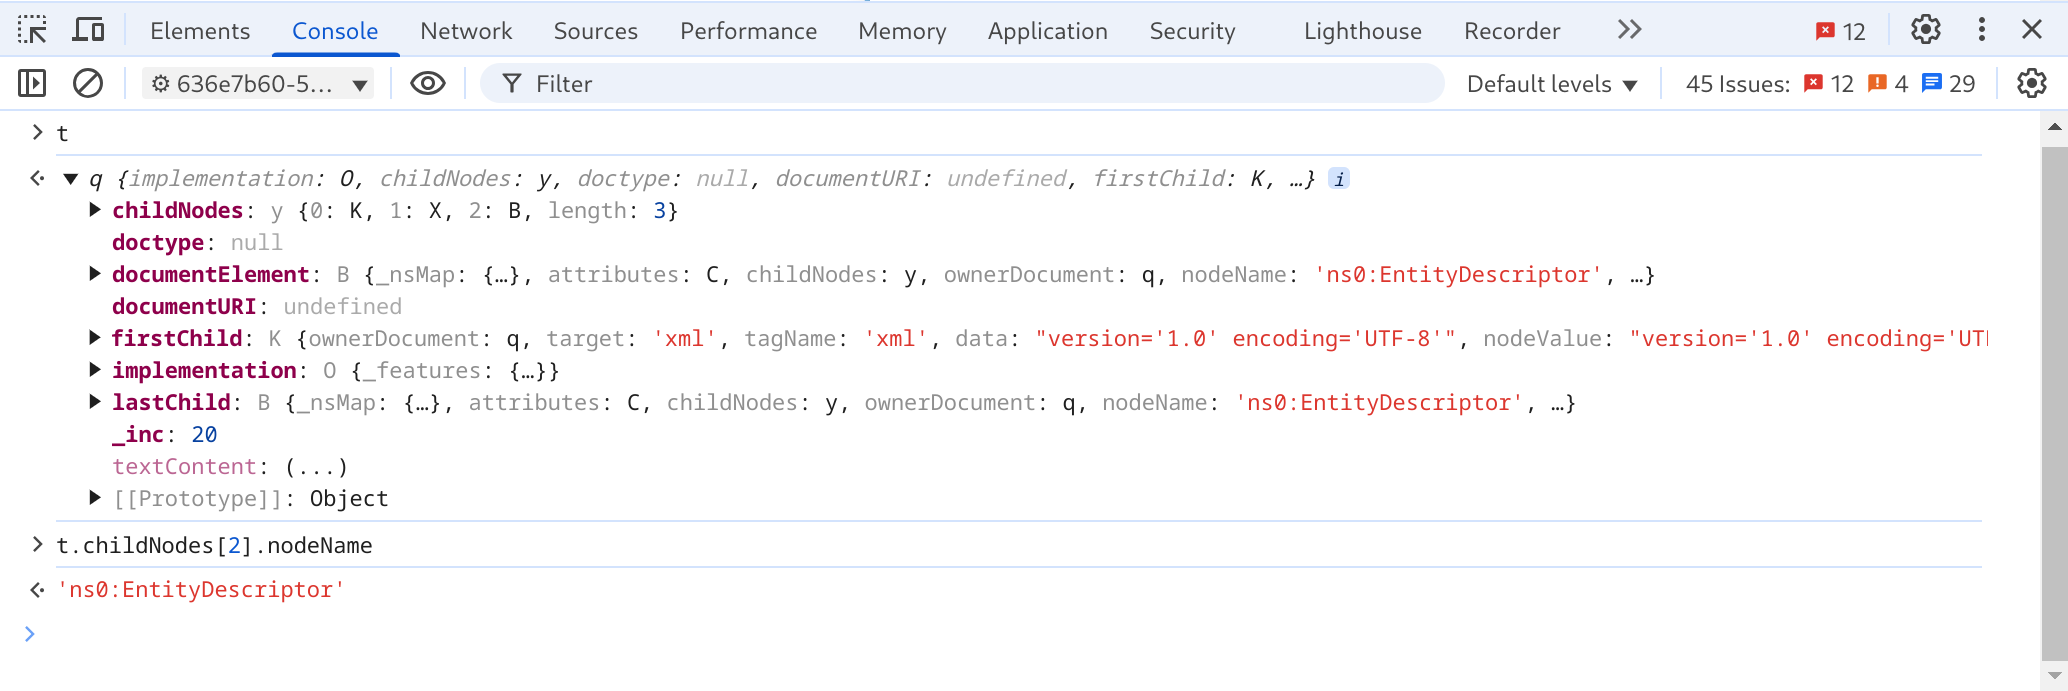
t- the parsed XML file) - Using Chrome’s console, I can poke further in the variables (running
t.childNodes[2].nodeNameto verify that my XML file’sEntityDescriptoris in fact loaded)
In this case, the error is obvious. The Entra portal’s XML parsing does not handle XML namespaces irrespective of aliases. To workaround Entra’s issue, I needed to write my XML file with specific namespace aliases (md: instead of ns0:).
Spending a few minutes with the debugger saved a lot of time staring at non-existent documentation or even submitting a support request.
What about bigger apps?
The bug isn’t always this obvious. For instance, when investigating Webflow crashes during my work at Relume, I had to undertake some additional steps:
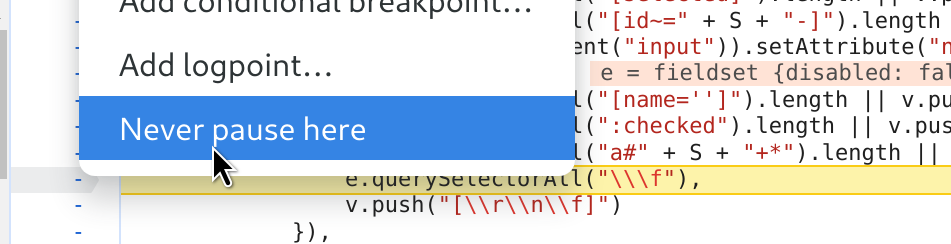
- Parts of Webflow’s coded follow the idiom of “Ask Forgiveness, Not Permission.” So my debugger would repeatedly pause in code that used exceptions for control flow; pausing before I even started reproducing the bug. That is easily fixed by right clicking the line number and selecting “Never Pause Here” then pressing
F8or “Resume script execution”.
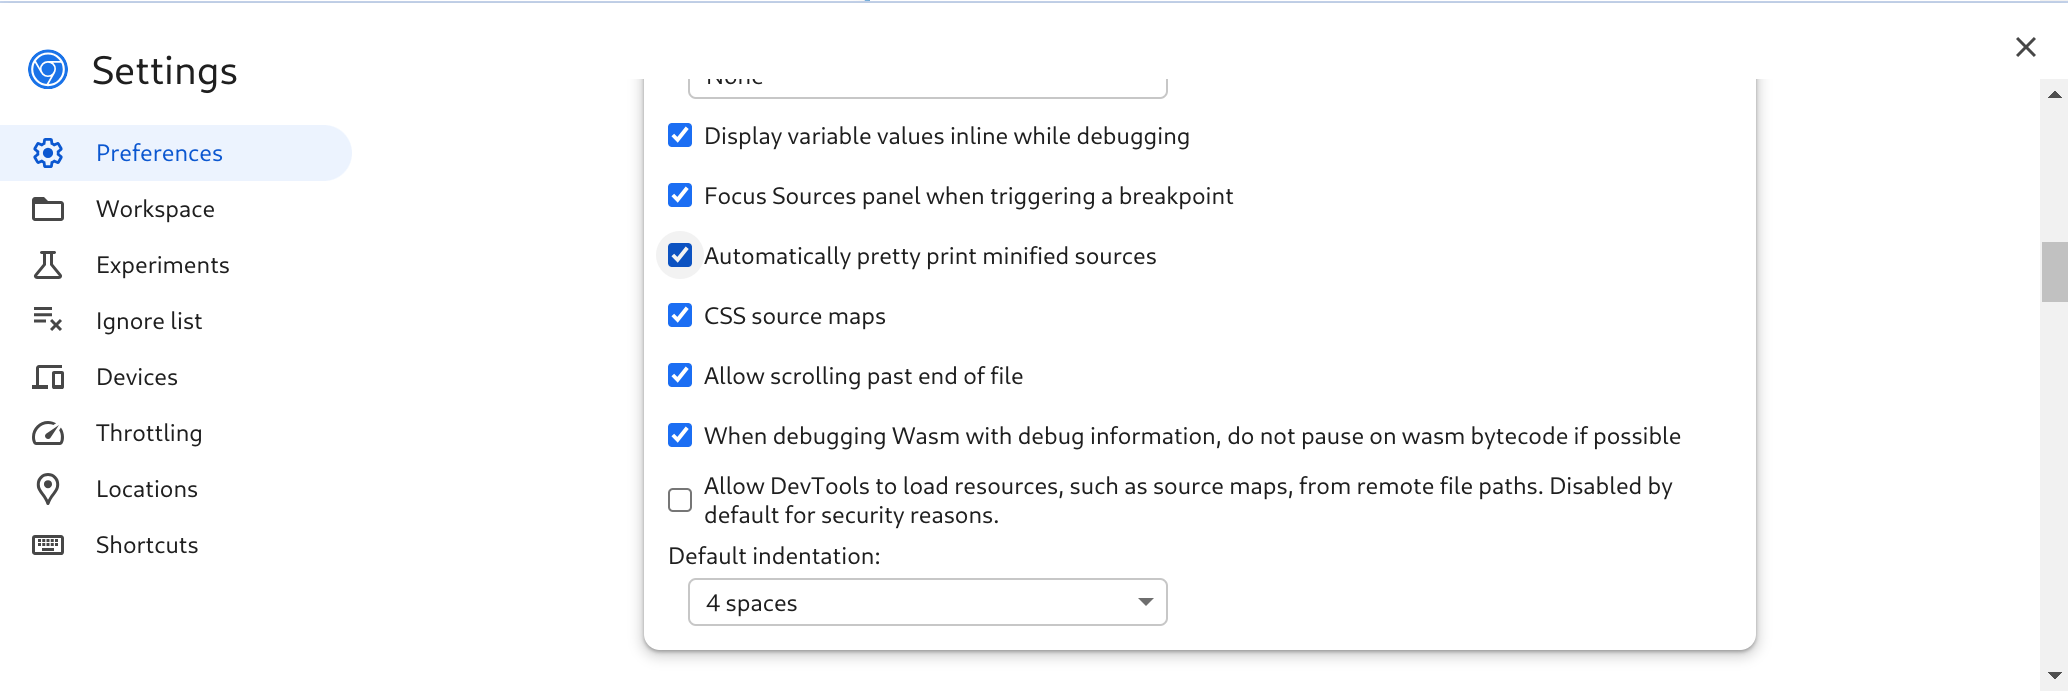
- Webflow’s code is minified. Make sure that “Automatically pretify minified sources” is enabled. Chrome will prompt you the first time, but you can change the option in the DevTool’s settings later too:
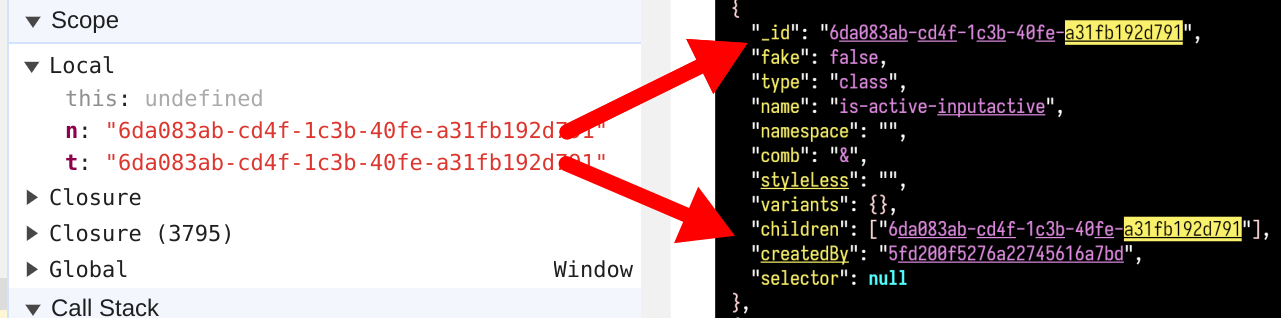
- Webflow’s code was more abstract than Entra portal. The code where the debugger paused was less informative about the issue. However, looking at the Local Variables in the Scope panel, I could see a UUID. Cross-referencing with my input, it was clear that I’d accidentally created a cycle in what was supposed to be a tree:
Conclusion
Next time you’re battling some baffling behaviour on a web app, I hope this strategy can help you get to the root cause. Try using Pause on Caught Exceptions to track down errors where the web app’s UI is hiding information you need to fix it.
Do you have other tips & tricks for building integrations with spottily documented services? If so, I’d love to hear them below.
I hope you enjoyed this article. Contact me if you have any thoughts or questions.
© 2015—2025 Sam Parkinson